
Lorain County Data
Community Health Assessment | Data briefs | New! Respiratory Disease Activity Dashboard | Other sources
Lorain County Public Health (LCPH) serves and supports a healthy community by making data-driven decisions. LCPH also wants partners, stakeholders and the public to have access to timely health data.
LCPH intends to provide data that informs the community, including policymakers, medical personnel, researchers, community-based organizations, government agencies and individuals to understand and respond to diseases, threats and underlying conditions impacting the health of Lorain County.
Data briefs
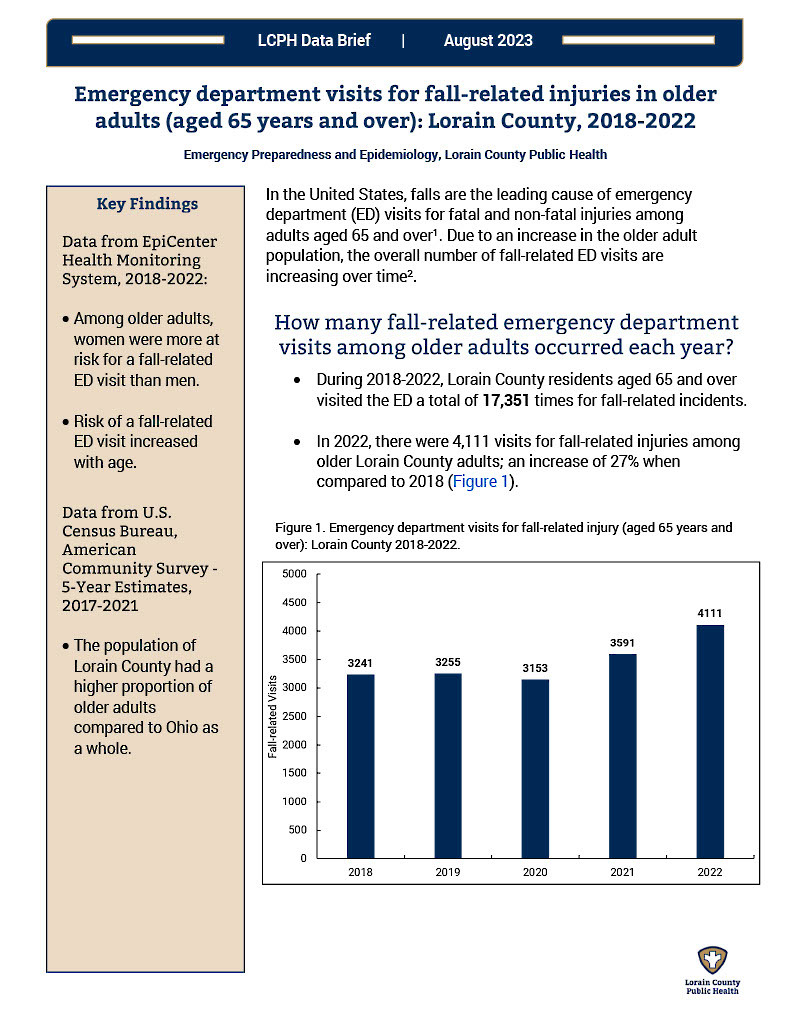
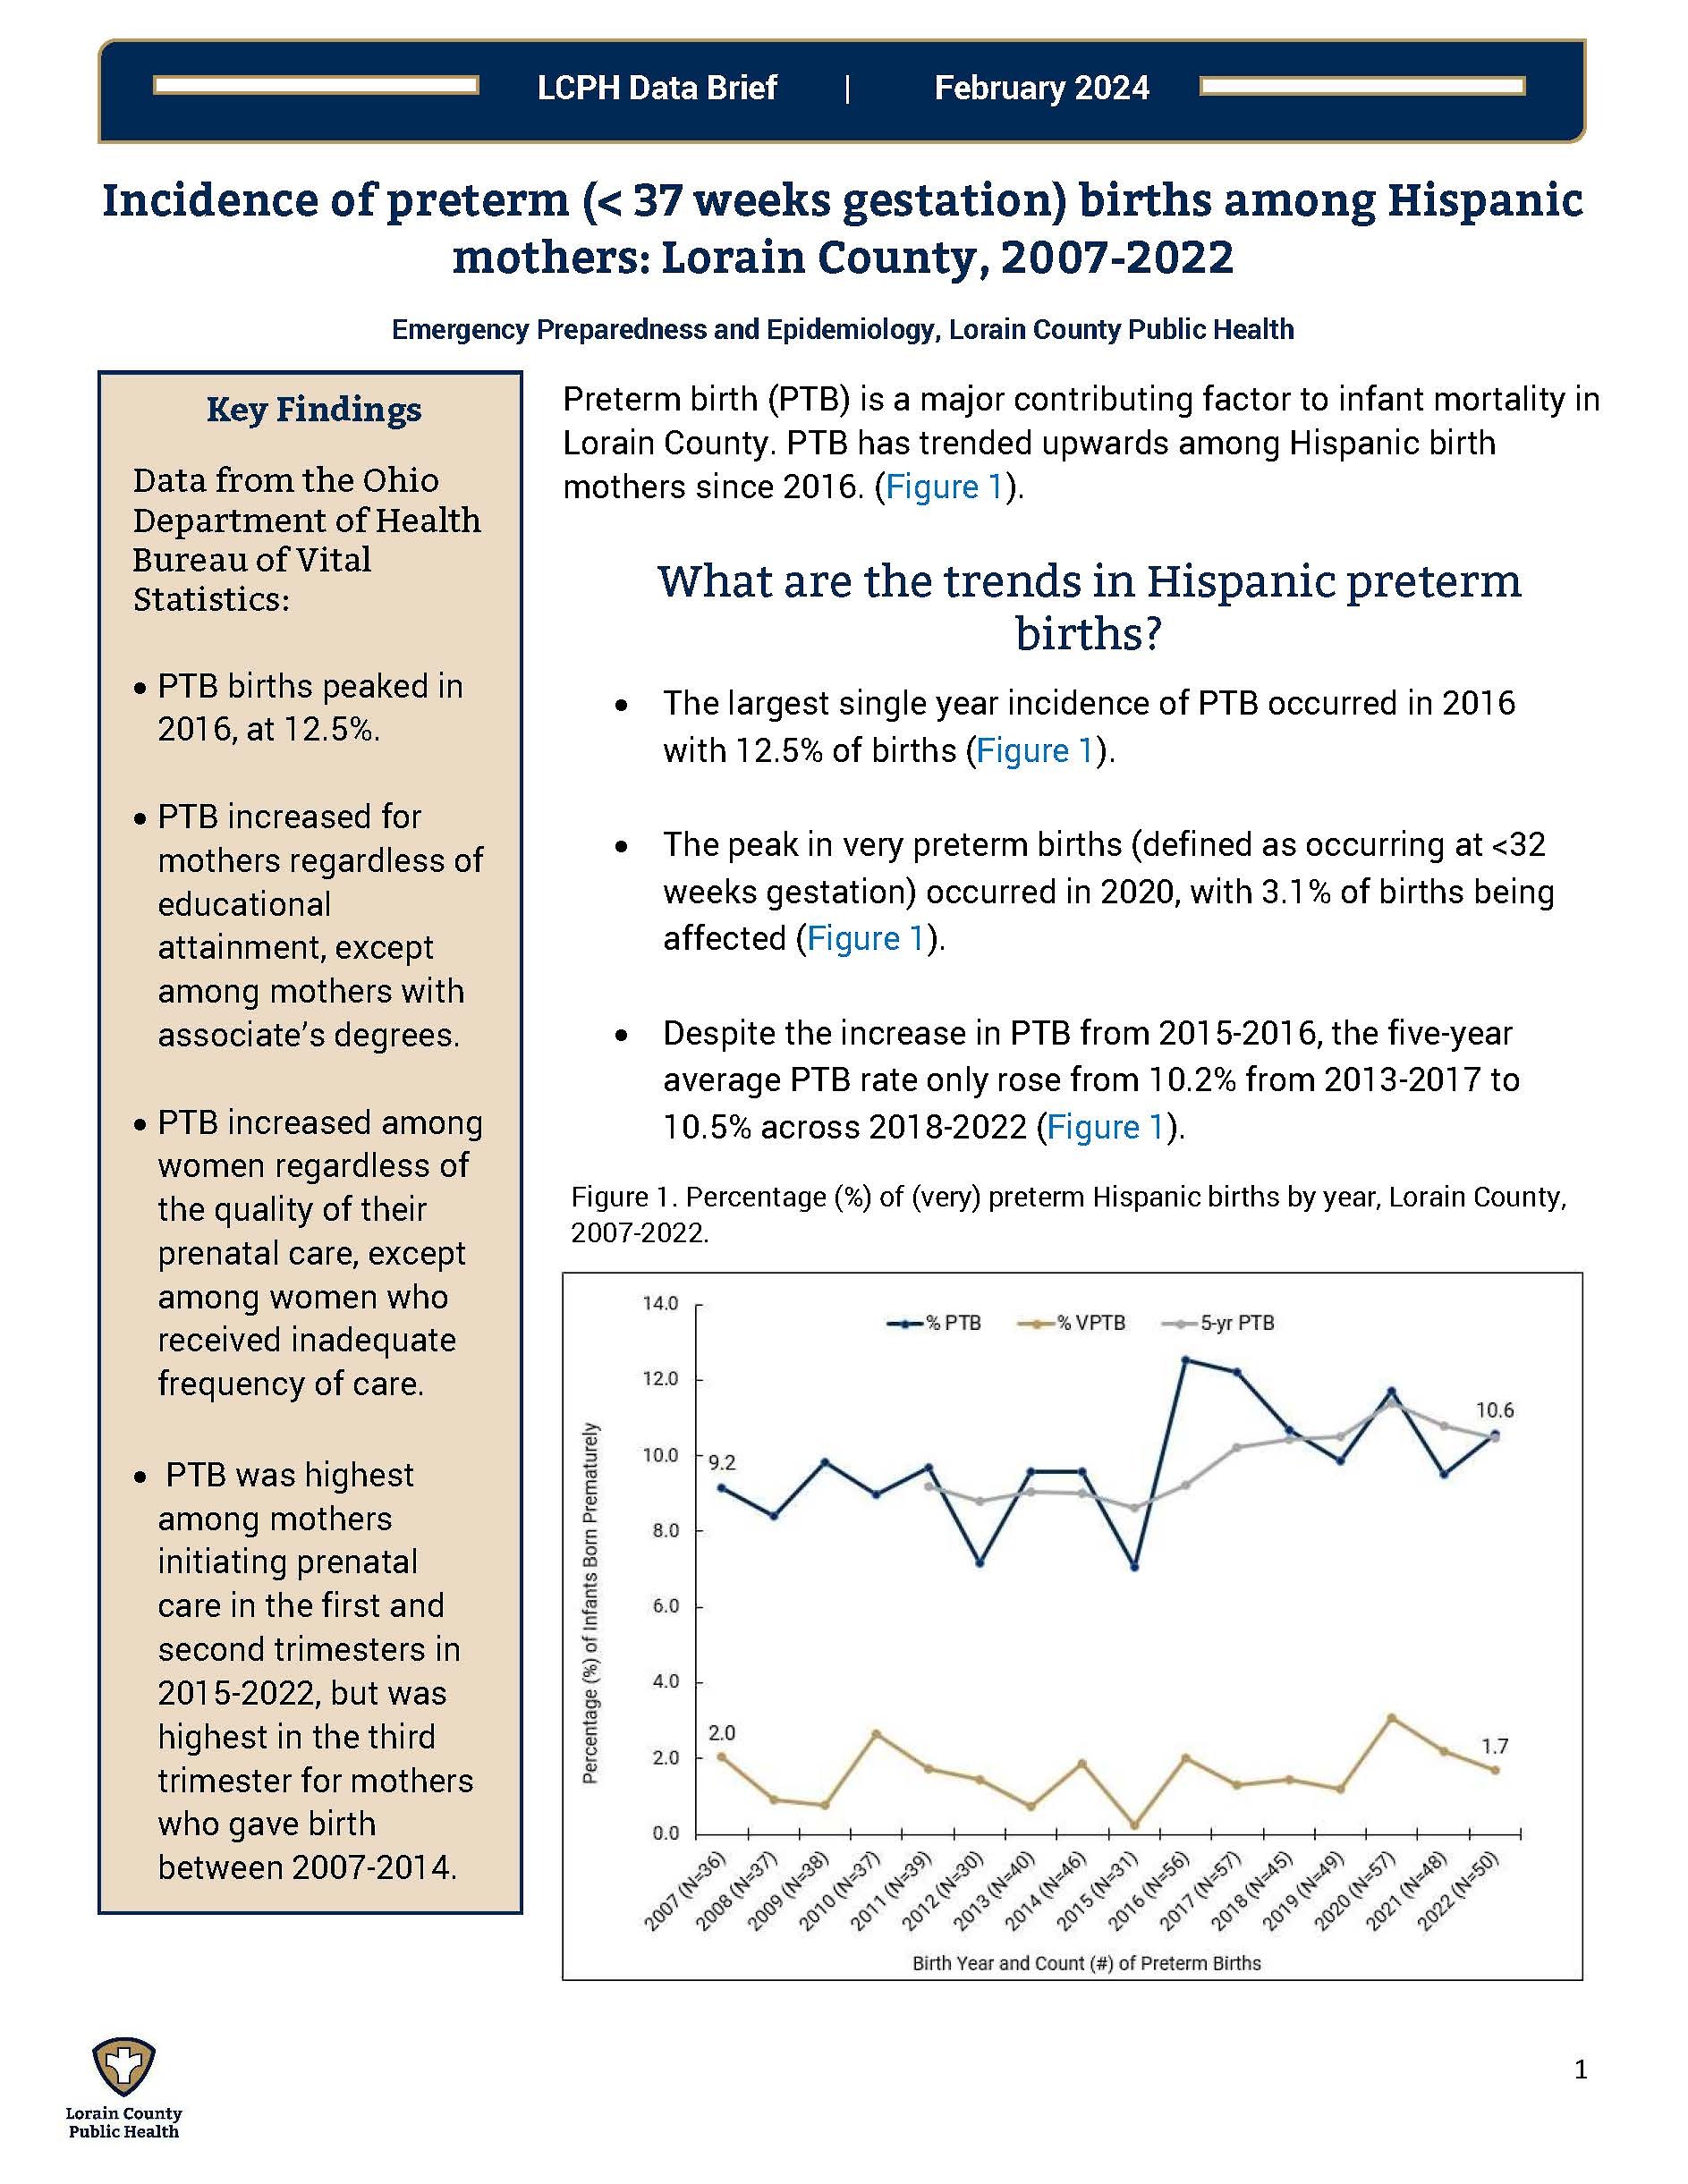
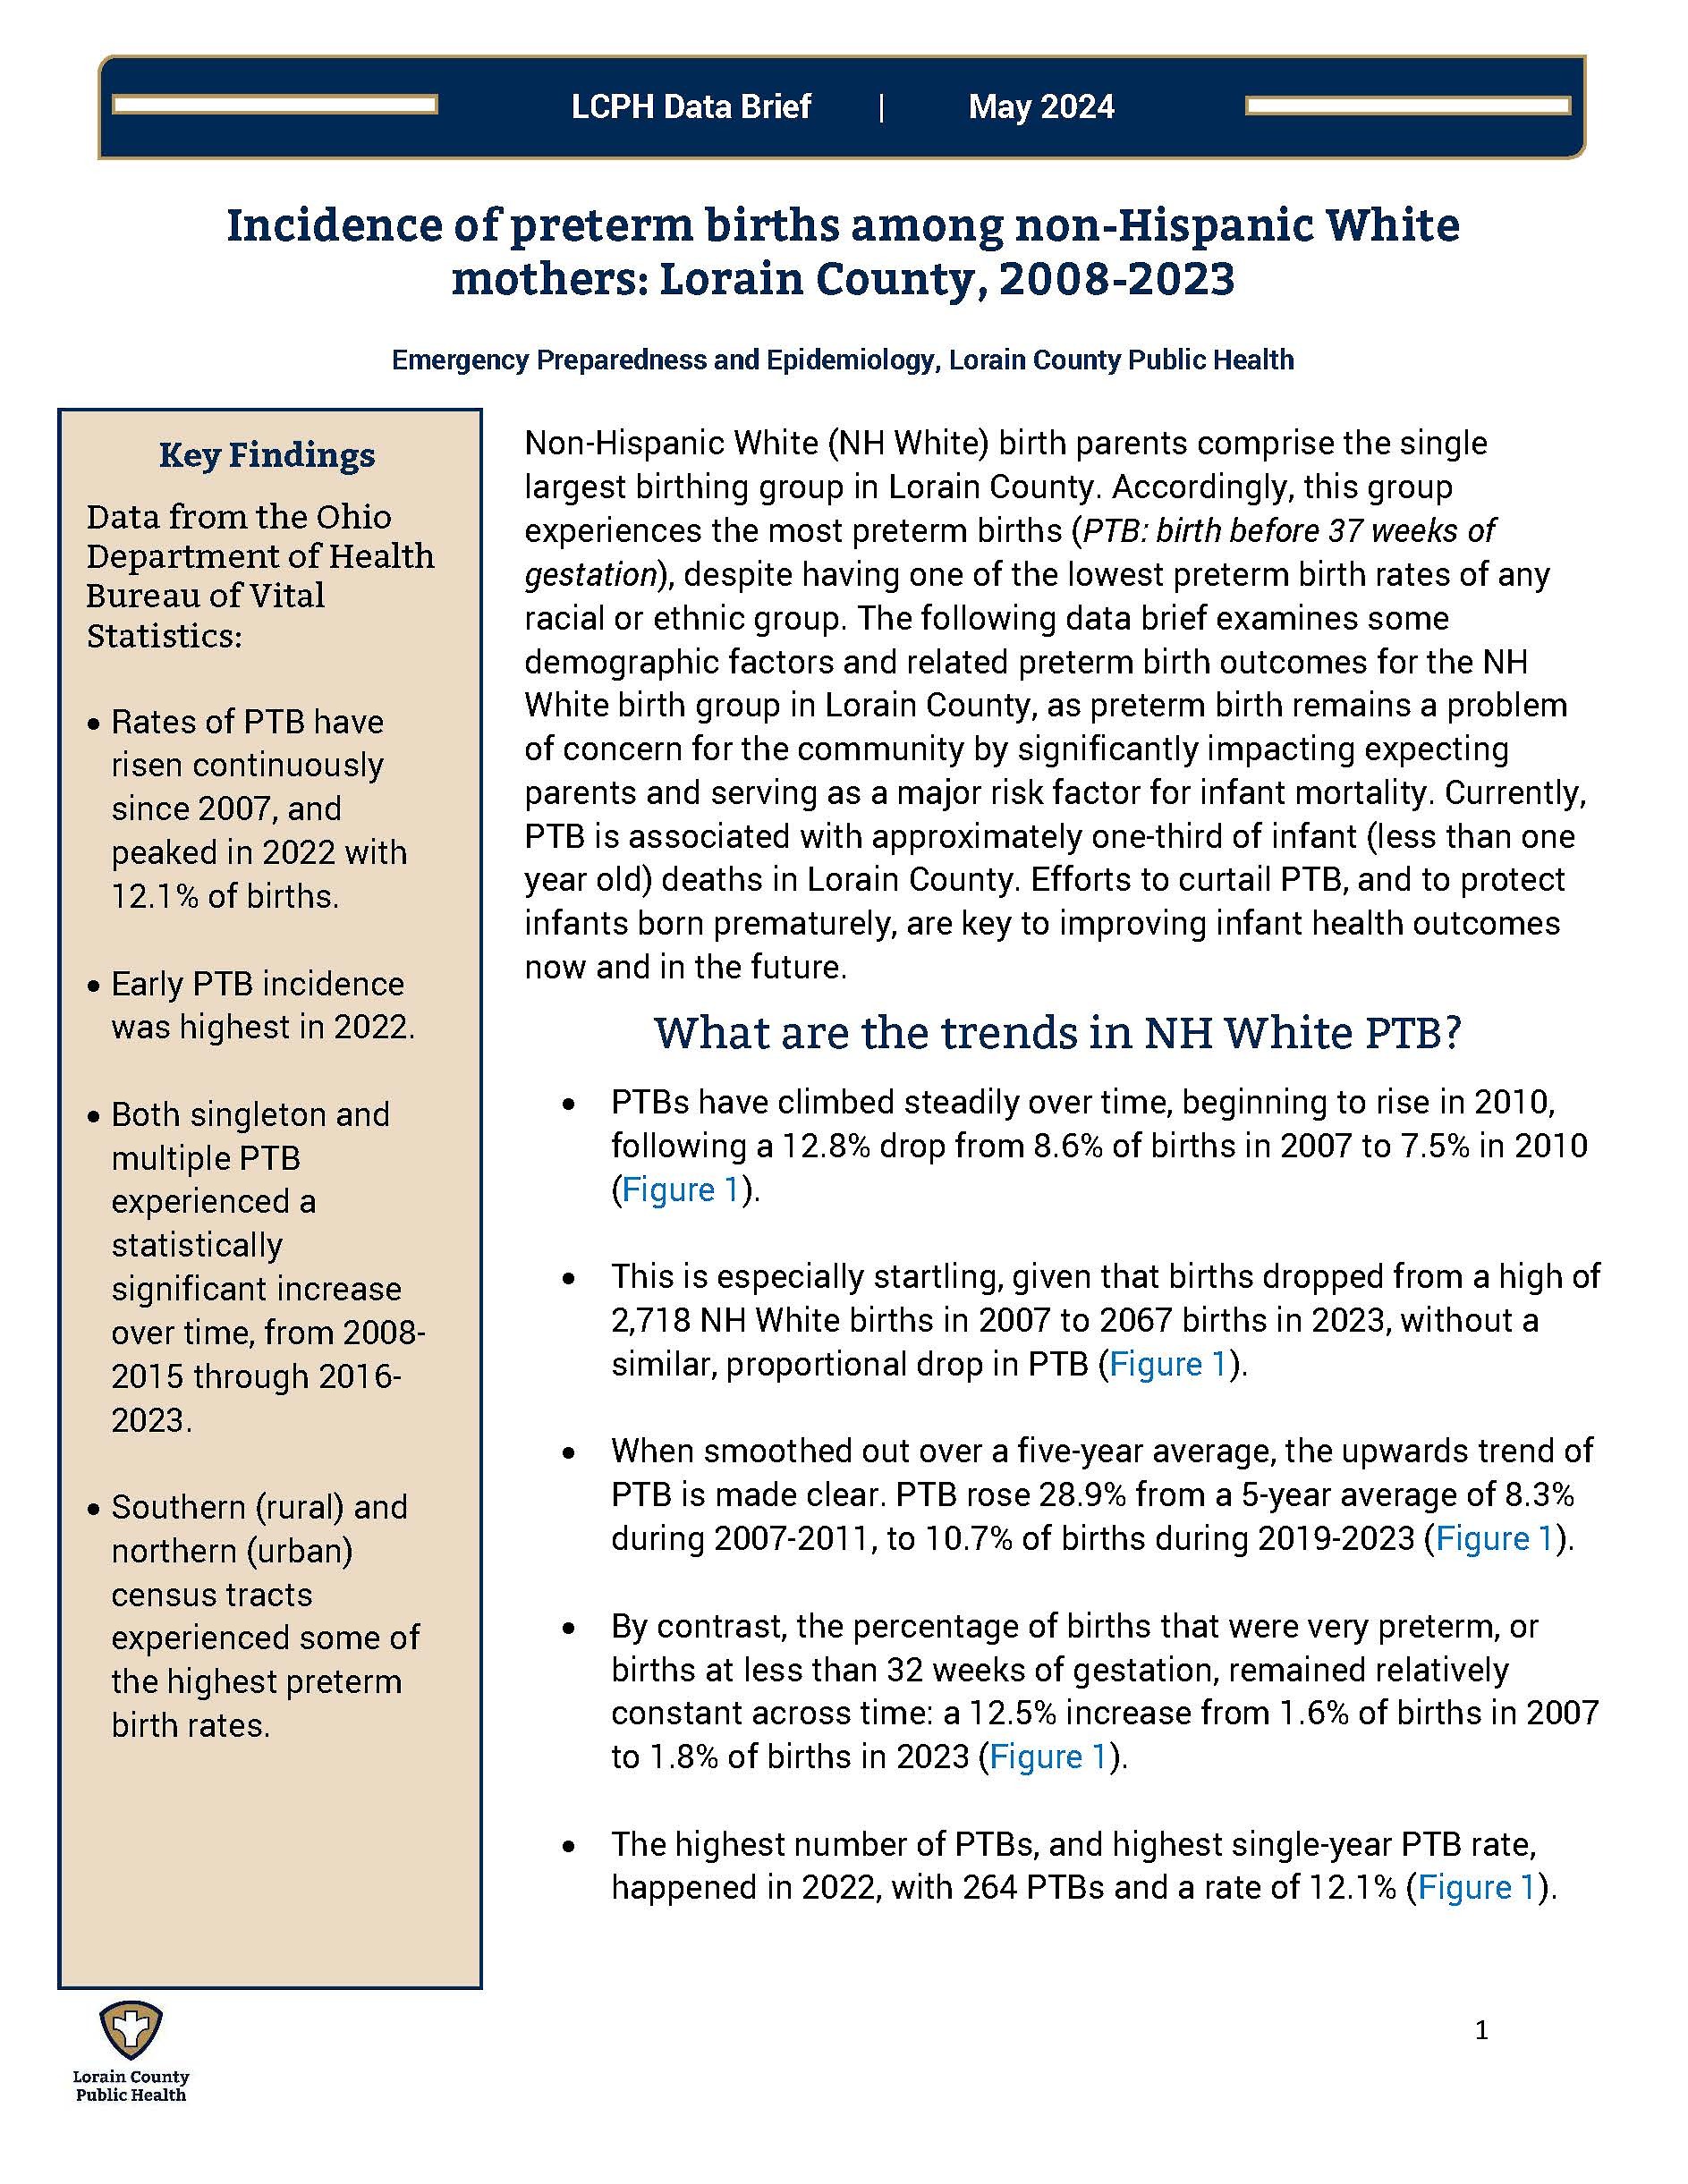
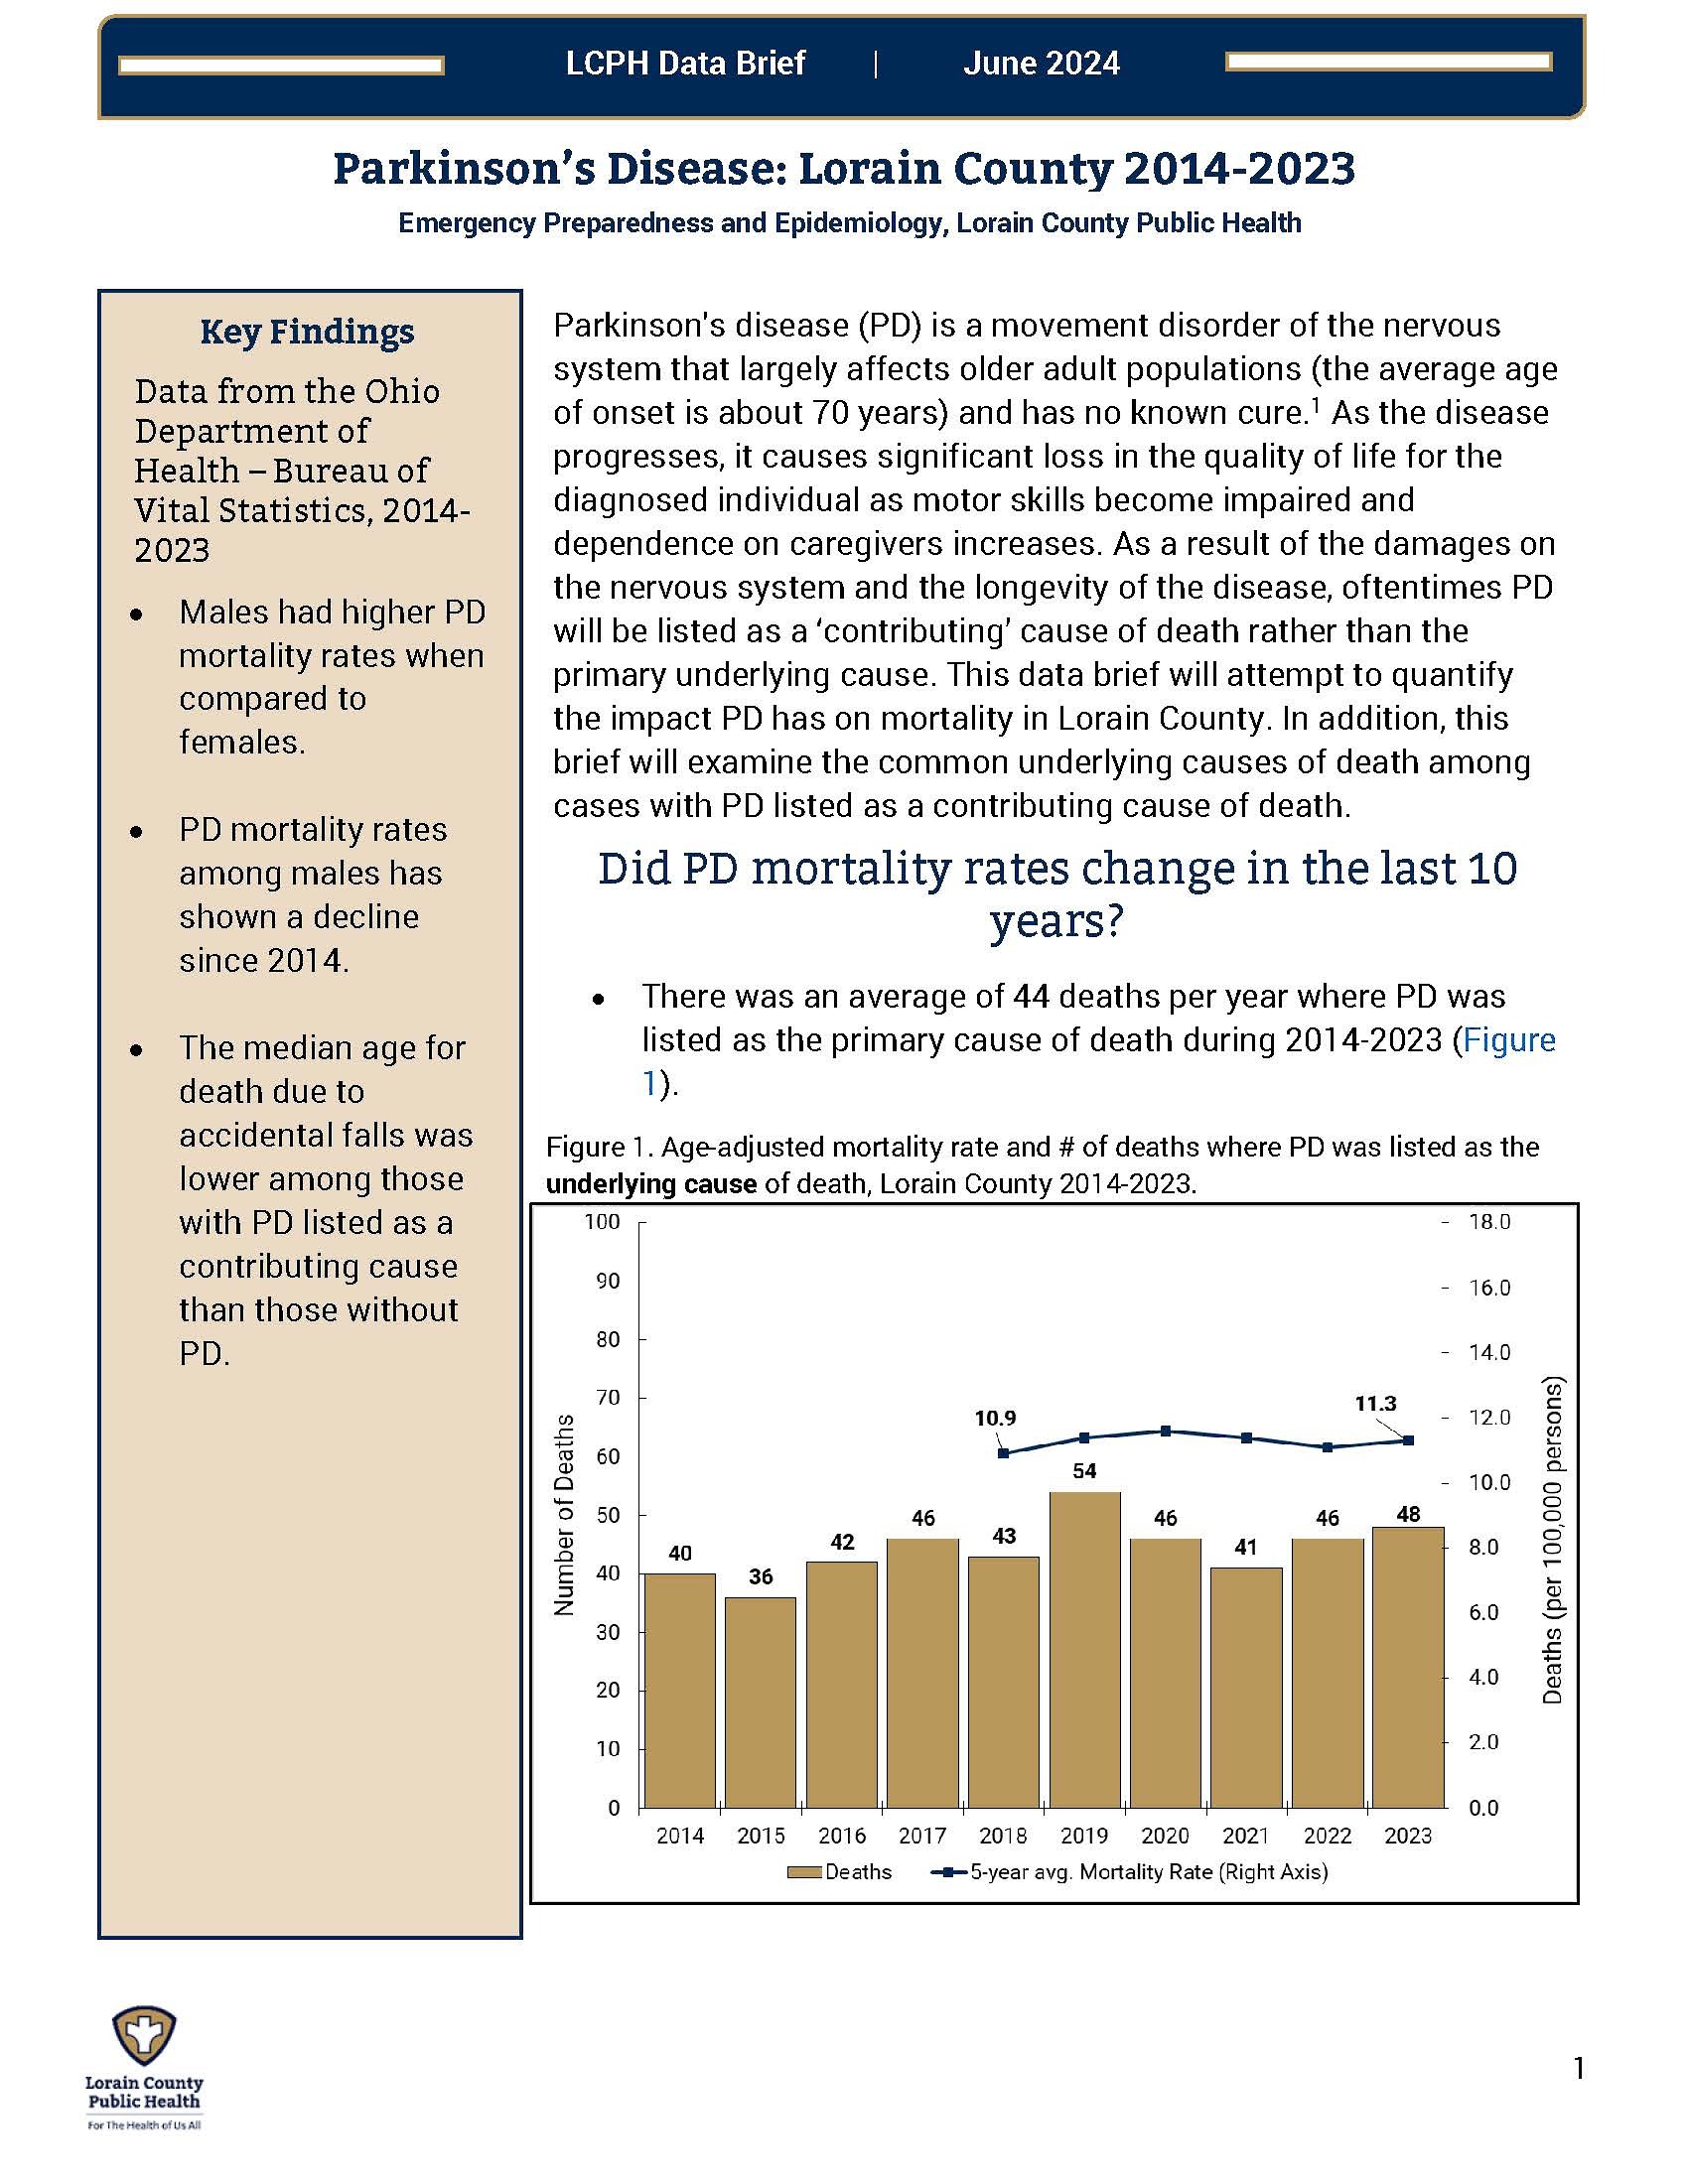
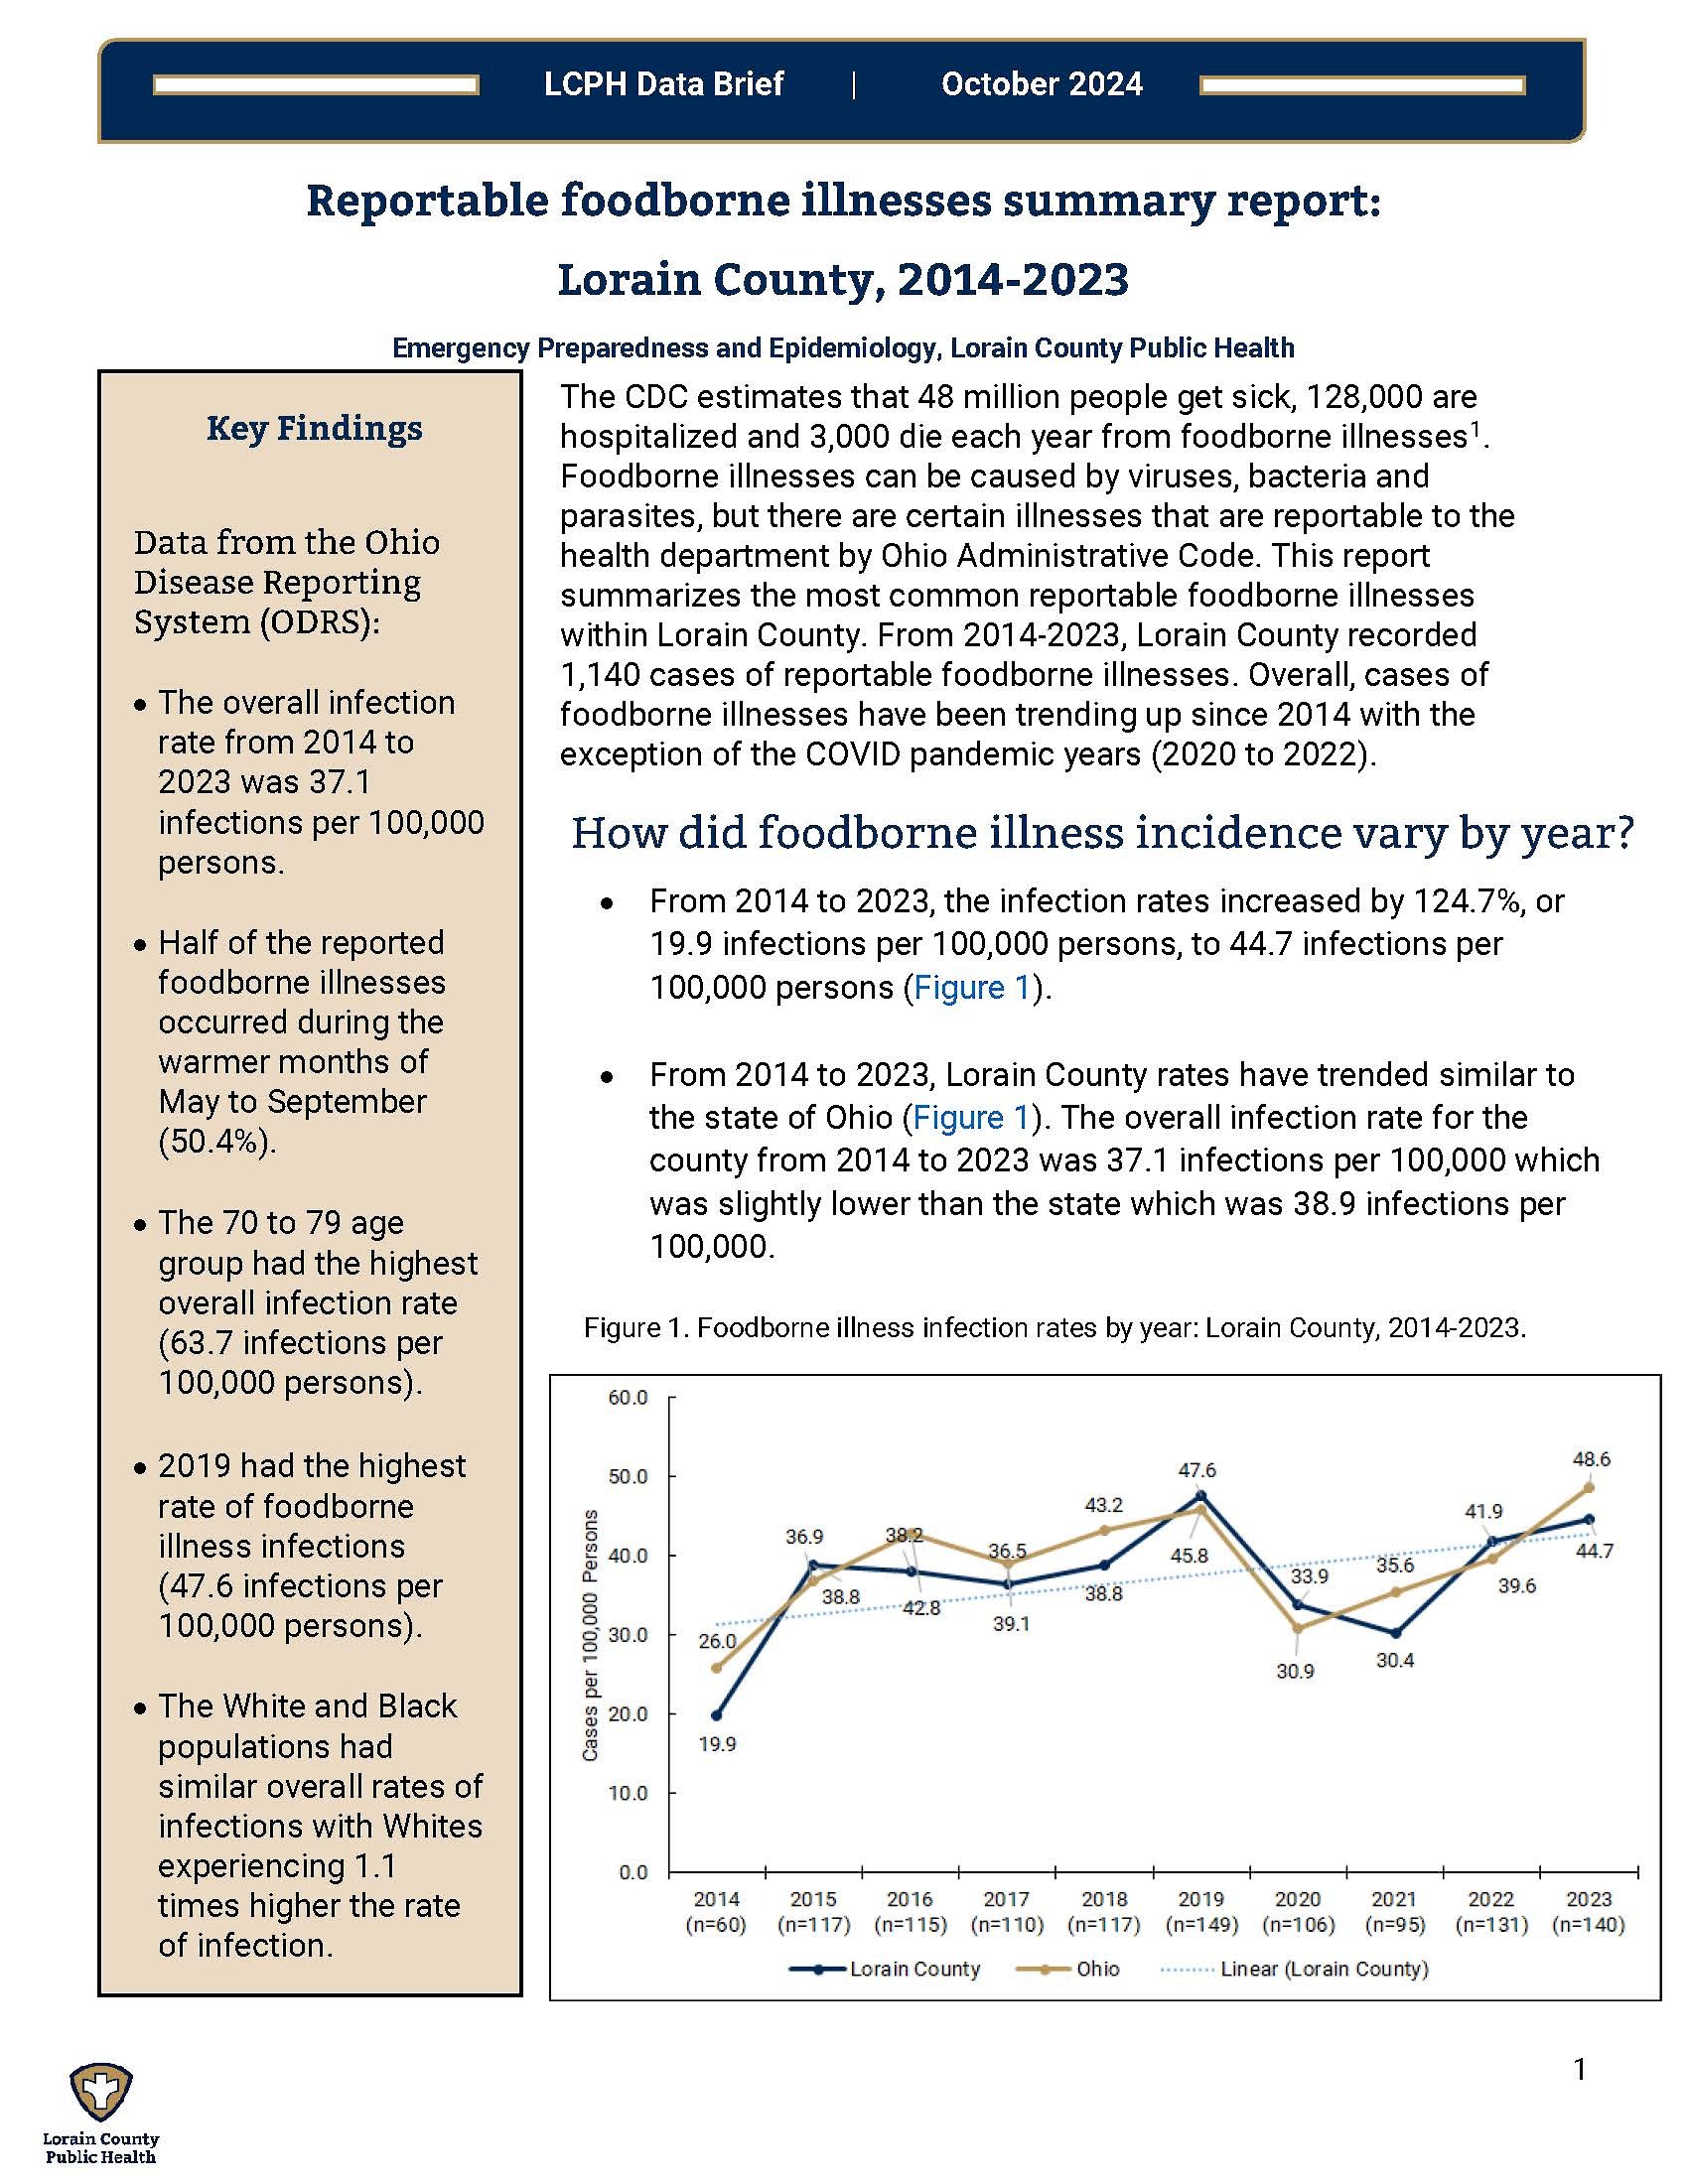
The LCPH health data team compiles information from a variety of sources in order to give a well-rounded view of a health topic. Check back for new topics. To ask questions about these data briefs, fill out the contact us form.
Language and terms in these documents conform with either those used by the Centers for Disease Control, by the Ohio Department of Health, or with the dataset from which the data was drawn.

Respiratory Disease Activity Dashboard
On Thursdays, October through May, LCPH updates this dashboard with respiratory disease activity for Lorain County, Ohio. We encourage using this data to help you make decisions throughout the respiratory disease season. Keep healthy, Lorain County.
Tip: View this dashboard on a desktop computer for the full dataset. Mobile viewing provides a condensed dataset, showing only key graphs.
- Influenza surveillance reports - Lorain County: 2023-2024 and 2024-2025
- COVID-19 data dashboard - Ohio statewide, including Lorain County, has been archived for 2020-2023. View 2024-present.
Other data sources
Lorain County Public Health considers the following websites as trusted sources of local health data: